Hope you have enjoyed my last blog. Now today I am coming with something special for you guys which is very very important from an interview perspective.
This question is considered a real-time case as well as asked to check your practical knowledge of Tableau.
In the interview, you might have faced such types of interview questions as what are the parameters and how you deal with parameters in Tableau?
Use cases where you have applied and used parameters. If you are going through a desktop round of interviews, then there are the highest chances to ask these questions. Also, sometimes you need to solve some cases where you need to use parameters.
In this article, I will discuss how to prepare yourself to answer the above questions and how to solve them very easily.
Let’s start our discussion step by step:
1. I am discussing one example where I am going to use parameters.
2. So here I want a dynamically changing axis to my chart. That is there is a drop-down list to select values and so that my axis should be changed according to the values selected.
3. Process to design the above case as follow:
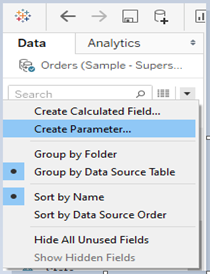
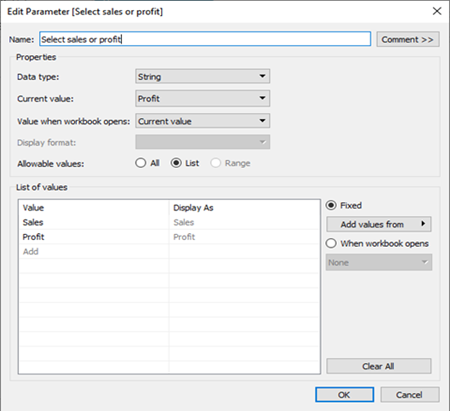
a. Create parameter just by clicking on the arrow next to the search bar in the data section name as “Sales or Profit?”. Change the properties like data type as String, Allowable values as List. Add values into the ‘List of values’ sections where add display names in the ‘Display As’ section. Click ‘OK’. Here we will change the view dynamically by sales or profit.
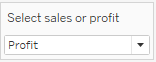
b. Right-click on the parameter and click the Show Parameter. I can see the parameter legend getting enabled as below image:
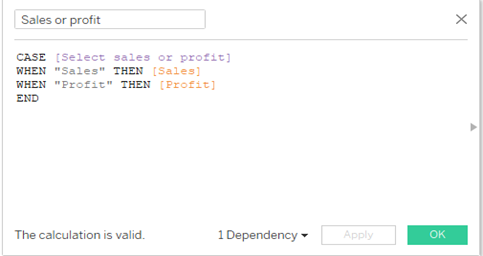
c. Now create a calculated field named ‘Sales or Profit’ which has a definition in the image below. This calculation will be working as if I select Sales in the parameter then my axis will be changed to take values of Sales and the same for-profit also.
d. Create a view. Drag [Region] into columns shelf and calculated field [Sales or Profit] on Rows shelf.
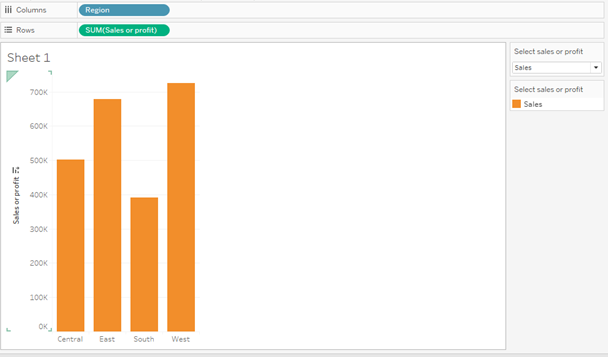
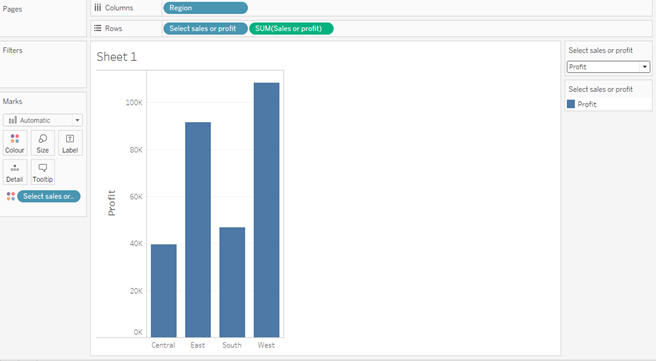
e. Change the name of the axis dynamically.
For that just drag the [Select Sales or Profit] parameter on the axis. Here I can see the axis names are also changing as we are switching between parameter values.
Keep this article open in your browser and just try these steps on your Tableau desktop or Tableau Public.
I hope you understood it very well and well prepared to chase the interview.
Thank you!
Also try the below articles at your end, So that you will be more prepared for the interview.
Recently asked Tableau Interview questions
How to explain Project in interview?
How to explain domain specific KPIs?
Day to day responsibilities in working company