
Advanced Parameters in Tableau
Advanced Parameters in Tableau Advanced Parameters in Tableau What are the parameters in tableau? Parameter is one of the

Filters in Tableau
Filters in Tableau Tableau is one of the best data visualization tools in all BI tools in the world. Its
Top 10+ Tableau Server Interview
Top 10+ Tableau Server Interview Questions What is TABLEAU SERVER and how it differs from the TABLEAU DESKTOP? Tableau server

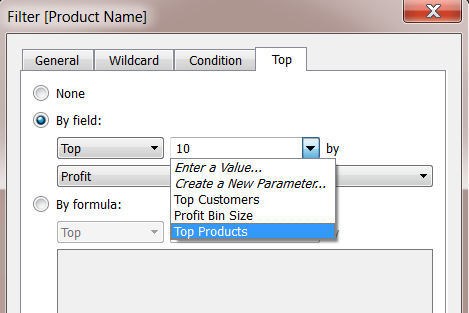
Top N sub-categories from each
How to find top N sub-categories from each category? Here will discuss how to find top N subcategories from each category

Top 10 Tableau interview questions
Top 10 most important interview questions for Tableau developer 2021 1. What are the different types of filters in Tableau?Tableau
Tableau Parameters Problems Solving Tips
Tableau Parameters Problems Solving Tips and Tricks Hope you have enjoyed my last blog. Now today I am coming with
Different Ways to create Parameters
Options to create Parameters in Tableau… Are you struggling to make your dashboards dynamic?Confused about Parameter creation like how to
Show me Section in Tableau…
Did you find my last article helpful? Click here to Read Again... If you haven’t gone through it please read

What are the KPIs you
Want to be a Domain Expert or a Technology Expert? Here is some basic understanding about domain... Tableau interview In
Tableau Interview Questions asked in
Recently I faced many interviews for tableau developer and reporting analyst in Accenture, Marsh Maclennan, General Mills, BNP Paribas, Unifrax,
What are the projects you
Highlight your majorly working domains and projects you worked on… Tableau Interview Questions List Project Steps to explain in the

Explain your day-to-day life activities
Who said The first impression is the last impression? So In every interview, always this is the first question interviewer
Frequently used Tableau Terminologies…
In this article, I am going to share one of the famous and required for each and everyone who is
Top most frequently asked Tableau
5 minutes before Tableau interview… If you are preparing for a tableau interview/Tableau developer Job/Job in Business Intelligence/Real-Time case study